- Aim
- To investigate the effect of using different quadrat types on estimates of the size of a population
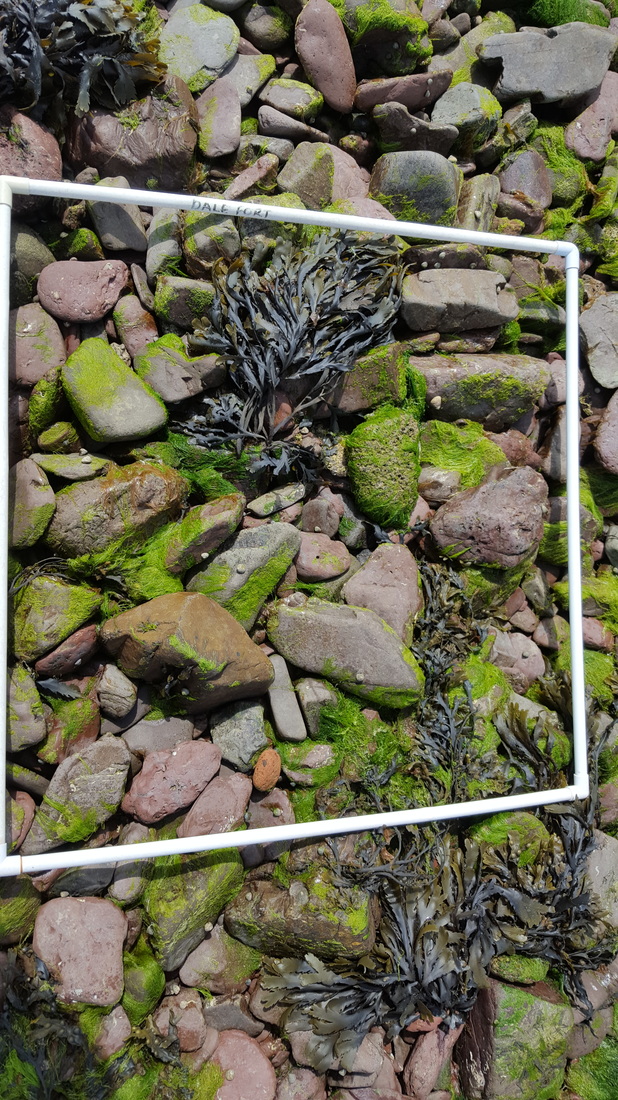
- To understand how to use a quadrat to estimate density and percentage cover
- Zonation on a sheltered rocky shore
- Splash Zone
- The section of the shore above the highest tides
- It has a high salt content as it is regularly splashed with salty sea water
- As it is always above the sea level it is always exposed to the wind
- Seabirds often rest on these rocks so their droppings produce patches of phosphate and nitrate
- Upper Shore
- The section of the shore between the highest tides and the mean height of neap tides
- Receives a lot of water all at once but then has long periods of no water so dries out regularly and experiences wide variation in temperature
- Has very little time to obtain nutrients from the water which results in slow growth and low productivity
- Middle Shore
- 20-80% cover by sea water
- Lower levels of light than the upper shore
- Variable tmeperatures
- Lower Shore
- Spends a majority of its time under water so has a relatively constant environment
- Light struggles to penetrate the water so has a reduced light intensity
- Highest productivity of any zone and competition is intense
- Splash Zone
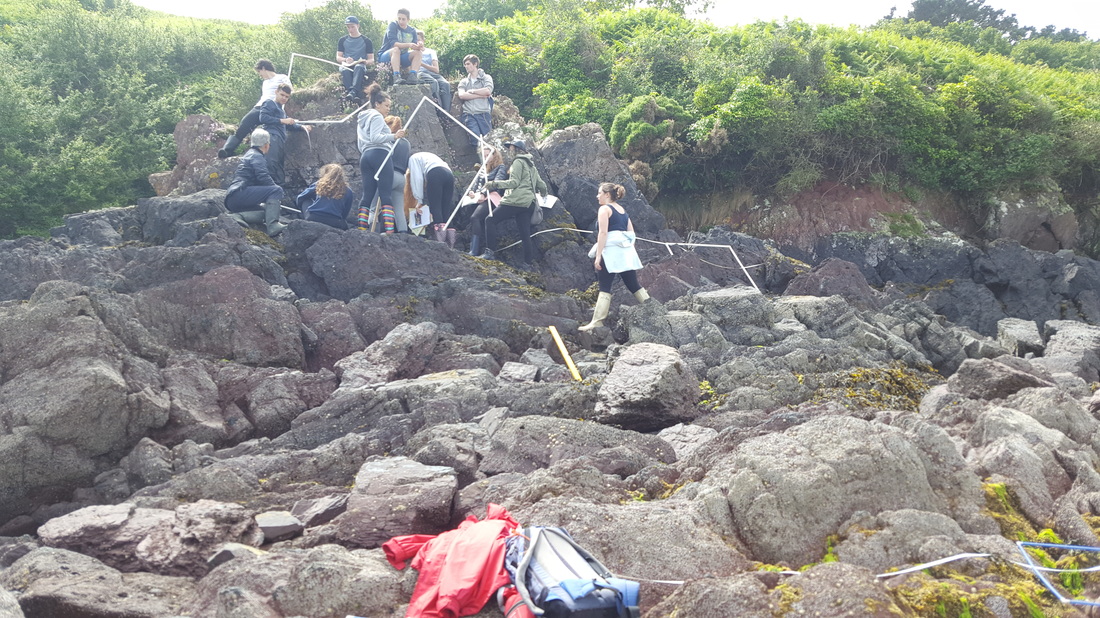
- Method
- Zone the shore into splash zone, upper shore, middle shore and lower shore. We were helped by an ecologist to zone the areas, then place a quadrat down at a random place using a method called stratified random which uses a random number generator
- After placing the quadrat record which organisms are found at that particular height, instead of counting the number of organisms we use an ACFOR scale to estimate the occurrence. ACFOR stands for Abundant, Common, Frequent, Occasional and Rare and for plants and animals there is a separate scale.
- Complete an ACFOR survey for each height along the coast and record the results in a survery
- To be able to identify the organisms on the shore (many of which we have not seen before) we used flow charts and pictures to be able to identify which animals and plants were present. If we could not find out what the organism was we were able to ask a specialist who came with us
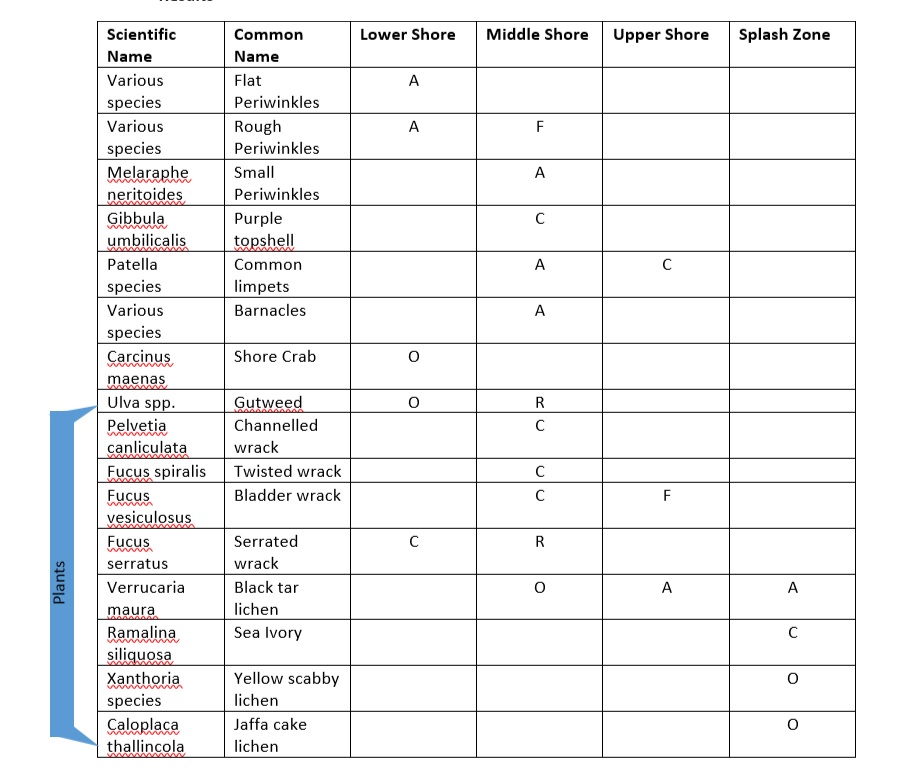
- Results
- Evaluation
- The ACFOR method has significant limitations these include
- For plants ACFOR takes into account area of the quadrat filled with the plant not the actual density, this would result in lichen, which grows outwards not upwards, to generally be more common compared to seaweed. This is despite the fact that there could potentially be a lot more seaweed.
- Similar to the plants, a large crab would take up a significantly larger area in terms of territory compared to many smaller crabs. As we assess animals or quantity this may show some results to be misleading. A way to get past this would be to assess organisms on weight however this would not be an ethical way to treat organisms as we do not want to displace an animal or plant for any length of time
- ACFOR is split into ranges (for example 100 – 80%) which means that in a survey two organisms could be the same letter whilst having quite large differences in rarity. To counteract this, you could reduce the percentage between letter but then you would have more than five letters. At a certain point this takes away from the fact ACFOR is meant to be an estimation and a general idea.
- Repeating the experiment
- As each group did one survey at each height misleading results may arise from the fact that at a certain height the topographical factors change drastically. This would result in different results depending on where on the line you placed the quadrat. To combat this, you could repeat the experiment to try get an average at each height or compare results with other groups to also reach an average. If we had more time we would have certainly repeated the experiment.
- We could have also done more surveys in a similar area on a sheltered beach and compared the results. This would make sure that our beach isn’t an anomaly due to a significant factor such as human intervention for example.
- Quadrats
- As much of the upper shore is steep and rocky, and we use a random number generator to place our quadrat it is possible that our quadrat may be on an angle of a sheer rock face. This makes it harder to know what is in the area and what is not as the quadrat is not flush with the surface.
- There is also a chance that we may not see all the animals within our quadrat. Animals naturally shy away from humans especially if we are in a large group and moving plants around them. It is therefore likely tha a crab could move out of our quadrat or even hide without us knowing. Although we had a good search without uprooting or displacing some of the environment it is impossible to say we found everything within the quadrat. This was a more prominent problem at the lower shore as there was dense seaweed slumping across a majority of the quadrat
- The ACFOR method has significant limitations these include